See Every Dollar, Grouped the Way You Buy
CostCrunch rolls every invoice line item up through your material catalog — category, type, and SKU — then charts it by day, week, or month. The spend report you keep rebuilding in spreadsheets, built for you automatically.
Line Items Don’t Add Themselves Up.
Five Names, One Material
Every supplier spells it differently, so your copper spend is scattered across a dozen line items that never add up.
Endless Hand-Sorting
Categorizing thousands of line items is a job nobody has time for, so it never actually gets done.
Blind Spending
You find out a category ran hot at month-end—long after the orders were placed.
Trusted by GC's and subs nationwide






Your Catalog, Organized Automatically
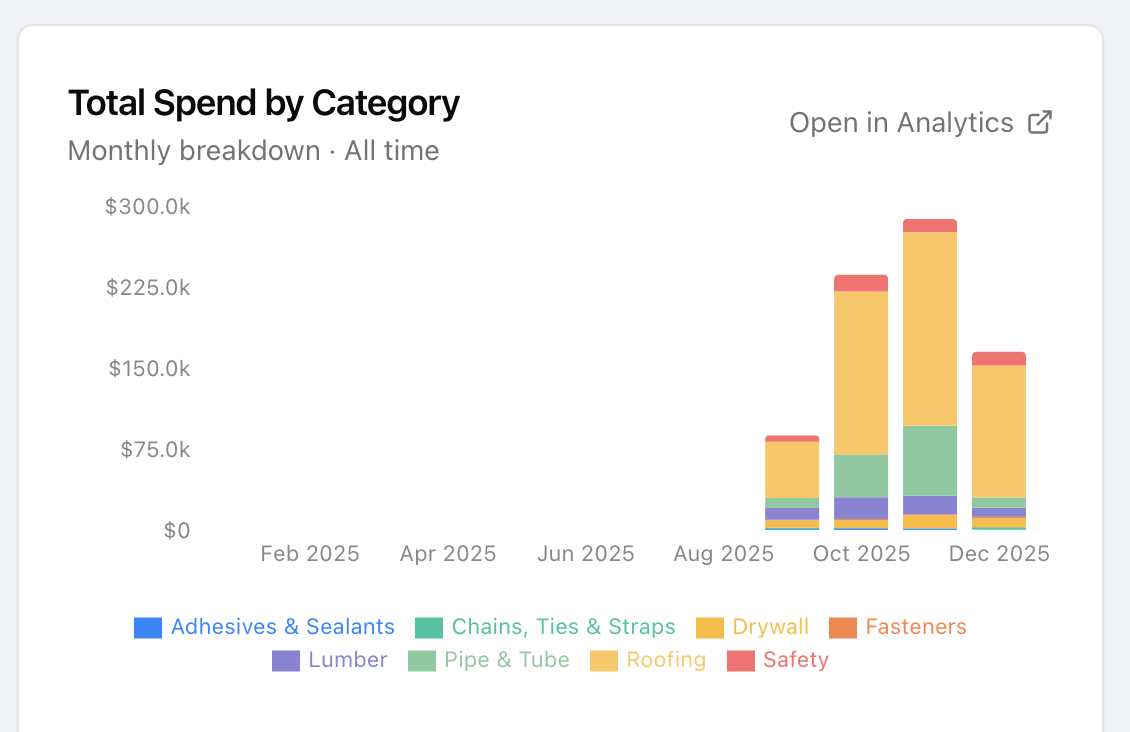
Total spend by category, over any timeframe
A stacked breakdown of where money went, by day, week, or month. Flip granularity in one click and watch the mix shift through the season — which categories are growing, which spiked, and exactly when it happened.
Spend rolled up through your material catalog
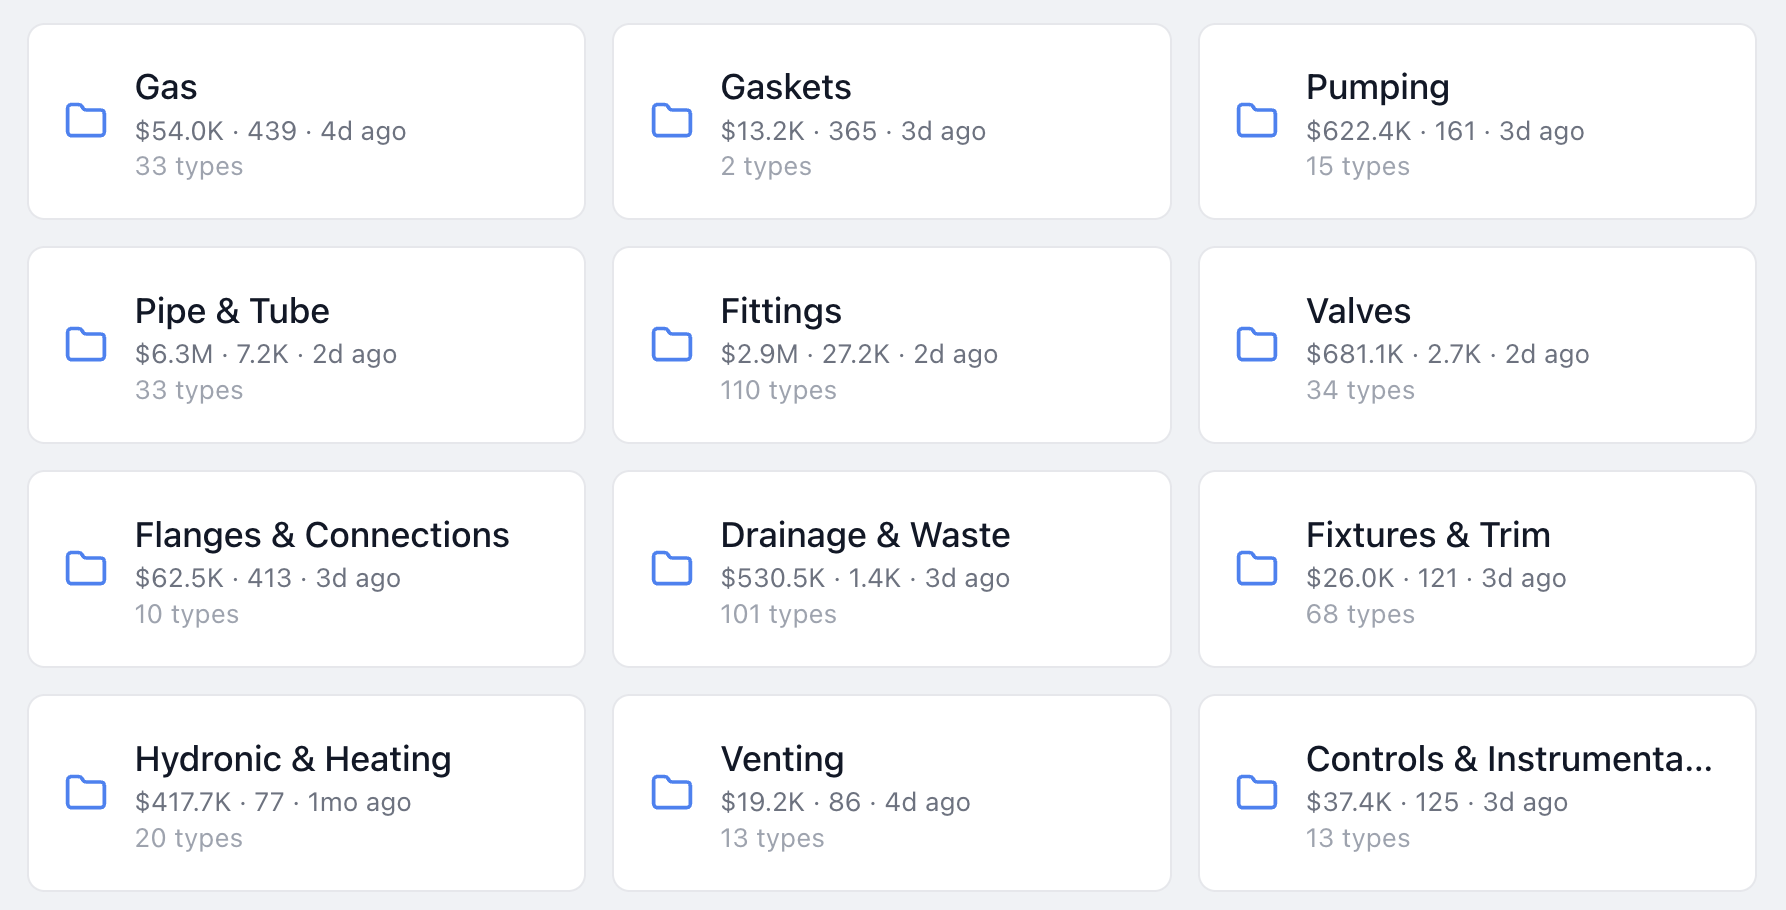
CostCrunch reads every line item, matches the naming variations back to a single catalog material, and files it into a taxonomy for you — Plumbing → Pipe & Tube → Pipe → 3/4" x 10' Copper Pipe. Expand any level to see what sits underneath, from a $430K category down to the one SKU driving the number.
A ranked summary you can act on in seconds
Every category with its dollar total and share of spend, biggest first. Two or three categories usually account for most of the bill — this is where you find them, and where negotiating leverage actually exists.
Filter by project, supplier, or material — then drill to the invoice
Slice by job, vendor, or SKU and every chart follows along. Click any bar to see the line items behind it, and open the original invoice PDF without leaving the page.